How do I do that in MATLAB

HOW DO I DO THAT IN MATLAB SERIES?

How do I solve simultaneous linear equations given in equation form? Updated Matlab 2018b

Guest co-blogger: : Luis Serrano

Many students ask me how do I do this or that in MATLAB.  So I thought why not have a small series of my next few blogs do that.  In this blog, I show you how to solve simultaneous linear equations given in equation form.

  • The MATLAB program link is here.
  • The HTML version of the MATLAB program is here.
  • DO NOT COPY AND PASTE THE PROGRAM BELOW BECAUSE THE SINGLE QUOTES DO NOT TRANSLATE TO THE CORRECT SINGLE QUOTES IN MATLAB EDITOR.  DOWNLOAD THE MATLAB PROGRAM INSTEAD

%% SUMMARY
% Language : Matlab 2018b;
% Authors : Autar Kaw and Luis Serrano;
% Mfile available at
% http://nm.mathforcollege.com/blog/SimultaneousEquationsEqForm.m;
% Last Revised : January 22, 2020;
% Abstract: This program shows you how to solve a set of
% simultaneous linear equations given in equation form?
% .
clc
clear all
%% INTRODUCTION
disp(‘ABSTRACT’)
disp(‘ This program shows you how to solve a’)
disp(‘ set of simultaneous linear equations given in equation form’)
disp(‘ ‘)
disp(‘AUTHOR’)
disp(‘ Autar Kaw and Luis Serrano’)
disp(‘ ‘)
disp(‘MFILE SOURCE’)
disp(‘ http://nm.mathforcollege.com/blog/SimultaneousEquationsEqForm.m’)
disp(‘ ‘)
disp(‘LAST REVISED’)
disp(‘ January 22, 2020’)
disp(‘ ‘)
%% INPUTS
% Enter the equations
syms a b c
eqn1=12*a+23*b+39*c==29
eqn2=13*a+17*b+19*c==37
eqn3=21*a+23*b+29*c==59
%% DISPLAYING INPUTS
disp(‘ ‘)
disp(‘INPUTS’)
disp(‘________________________’)
disp(‘Equations’)
disp(‘________________________’)
disp(eqn1)
disp(eqn2)
disp(eqn3)
%% THE CODE
% The solution
X=solve(eqn1,eqn2,eqn3);
% Assigning the output
a=double(X.a);
b=double(X.b);
c=double(X.c);
%% DISPLAYING OUTPUTS
disp(‘ ‘)
disp(‘OUTPUTS’)
disp(‘________________________’)
disp(‘Solution Vector’)
disp(‘________________________’)
fprintf(‘\nValue of a= %g’,a)
fprintf(‘\nValue of b= %g’,b)
fprintf(‘\nValue of c= %g’,c)
disp(‘ ‘)
disp(‘________________________’)

_______________________

This post is brought to you by

How do I solve a nonlinear equation that needs to be setup – Updated to MATLAB 2018b

Guest co-blogger: Luis Serrano

Many students ask me how do I do this or that in MATLAB. So I thought why not have a small series of my next few blogs do that. In this blog, I show you how to solve a nonlinear equation that needs to be set up.

For example to find the depth ‘x’ to which a ball is floating in water is based on the following cubic equation
4*R^3*S=3*x^2*(R-x/3)
where
R= radius of ball
S= specific gravity of ball
So how do we set this up if S and R are input values?

The MATLAB program link is here.

The HTML version of the MATLAB program is here.

  • DO NOT COPY AND PASTE THE PROGRAM BELOW BECAUSE THE SINGLE QUOTES DO NOT TRANSLATE TO THE CORRECT SINGLE QUOTES IN MATLAB EDITOR.  DOWNLOAD THE MATLAB PROGRAM INSTEAD

%% SUMMARY
% Language : Matlab 2018b;
% Authors : Autar Kaw and Luis Serrano;
% Mfile available at
% http://nm.mathforcollege.com/blog/NonlinearEquations_withSetUp.m;
% Last Revised : January 22, 2020;
% Abstract: This program shows you how to solve a nonlinear equation
% that needs to set up as opposed that is just given to you.
clc
clear all
%% INTRODUCTION
disp(‘ABSTRACT’)
disp(‘ This program shows you how to solve’)
disp(‘ a nonlinear equation that needs to be setup’)
disp(‘ ‘)
disp(‘AUTHORS’)
disp(‘ Autar Kaw and Luis Serrano’)
disp(‘ ‘)
disp(‘MFILE SOURCE’)
disp(‘ http://nm.mathforcollege.com/blog/NonlinearEquations_withSetUp.m’)
disp(‘ ‘)
disp(‘LAST REVISED’)
disp(‘ January 22, 2020’)
disp(‘ ‘)
%% INPUTS
% Solve the nonlinear equation where you need to set up the equation
% For example to find the depth ‘x’ to which a ball is floating in water is based on the following
% cubic equation 4*R^3*S=3*x^2*(R-x/3) R= radius of ball S= specific gravity of ball So how do we set this up if S and R are input values
S=0.6
R=0.055
%% DISPLAYING INPUTS
disp(‘INPUTS’)
func=[‘ The equation to be solved is 4*R^3*S=3*x^2*(R-x/3)’];
disp(func)
disp(‘ ‘)
%% THE CODE
% Define x as a symbol
syms x
% Setting up the equation
C1=4*R^3*S
C2=3*x^2*(R-x/3)
f=C1==C2
% Finding the solution of the nonlinear equation
soln=vpasolve(f,x);
solnvalue=double(soln);
%% DISPLAYING OUTPUTS
disp(‘OUTPUTS’)
for i=1:1:length(solnvalue)
fprintf(‘\nThe solution# %g is %g’,i,solnvalue(i))
end
disp(‘ ‘)

________________________

This post is brought to you by

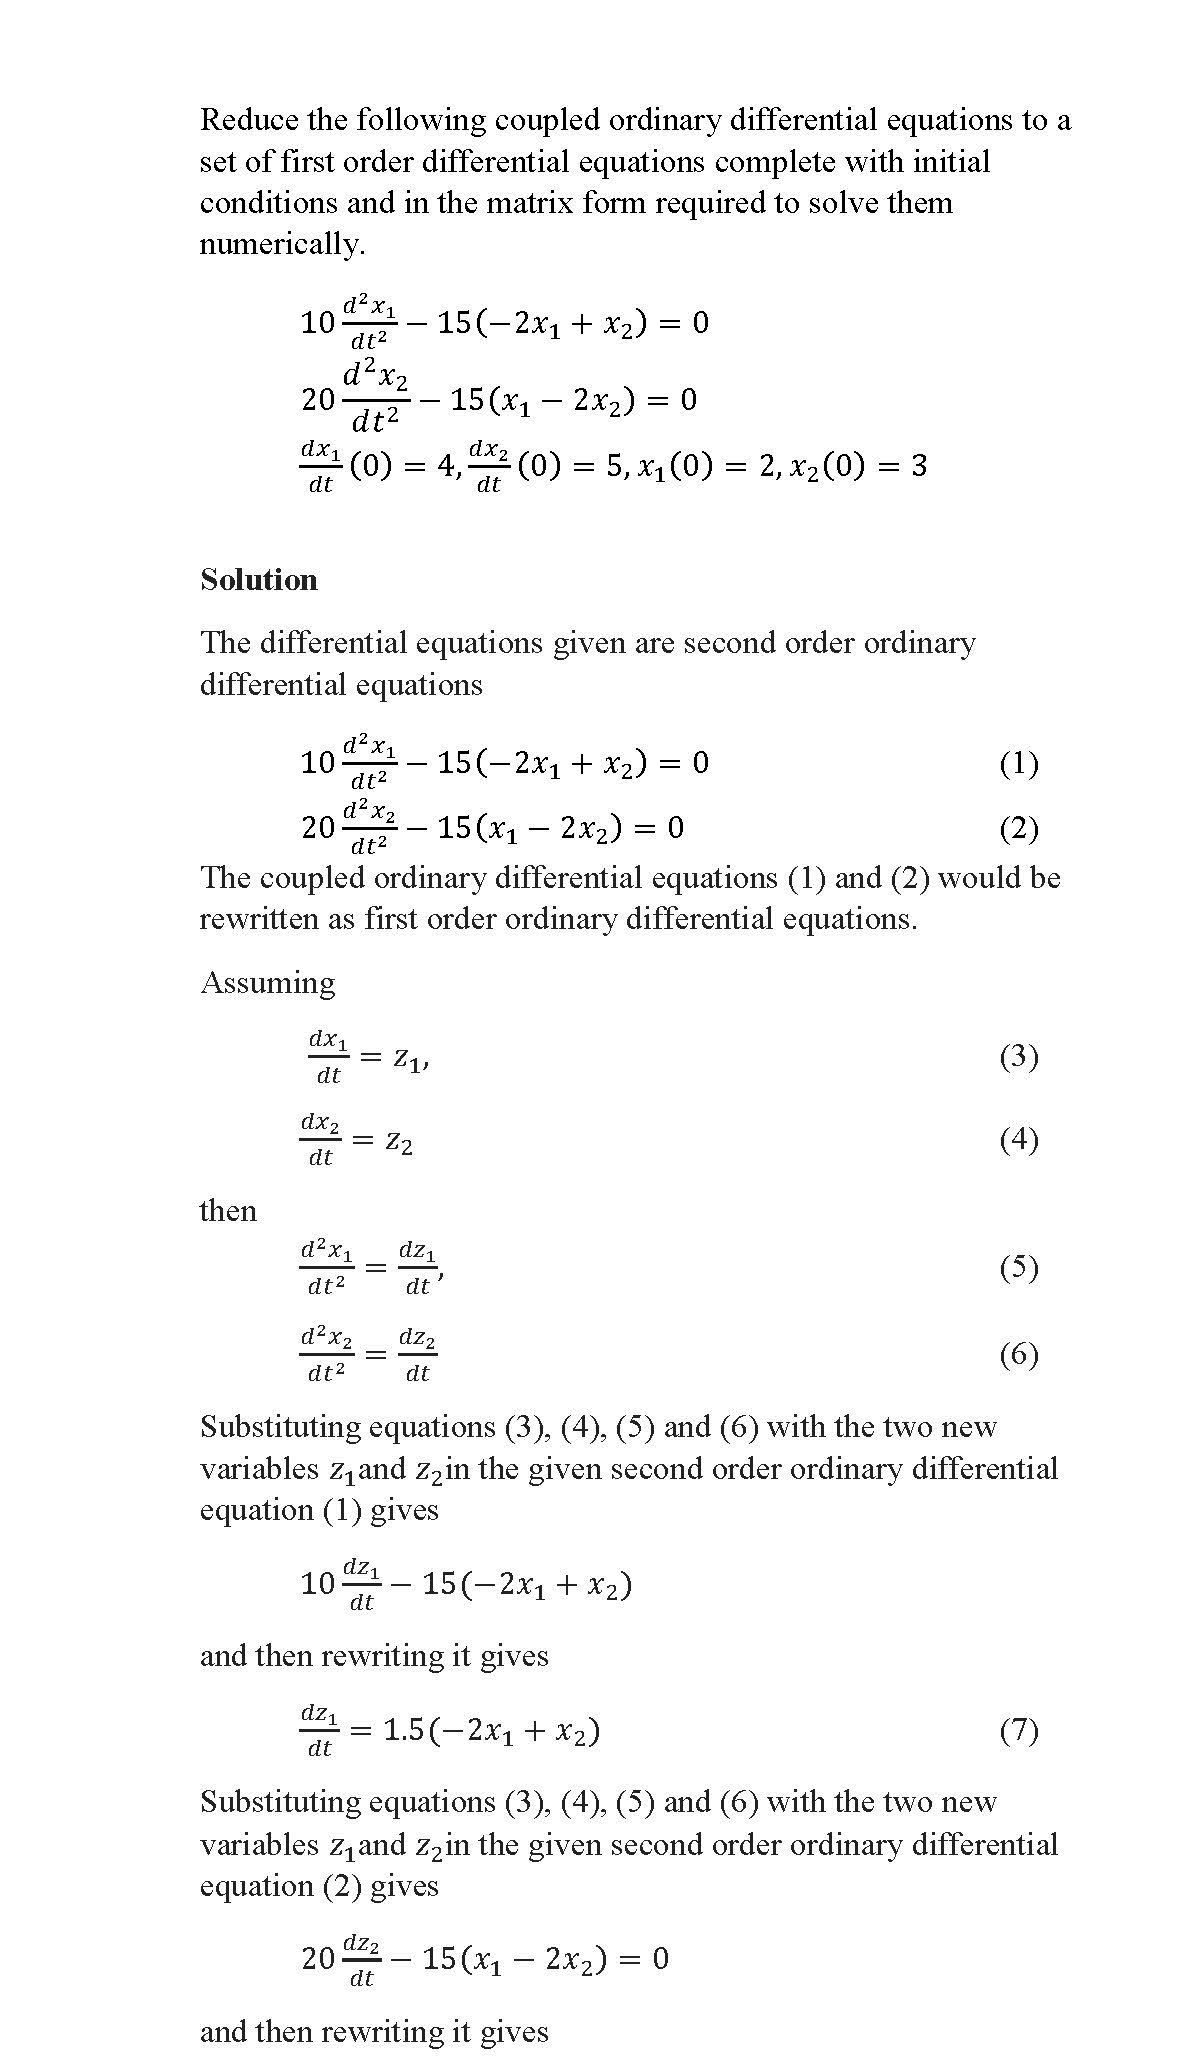
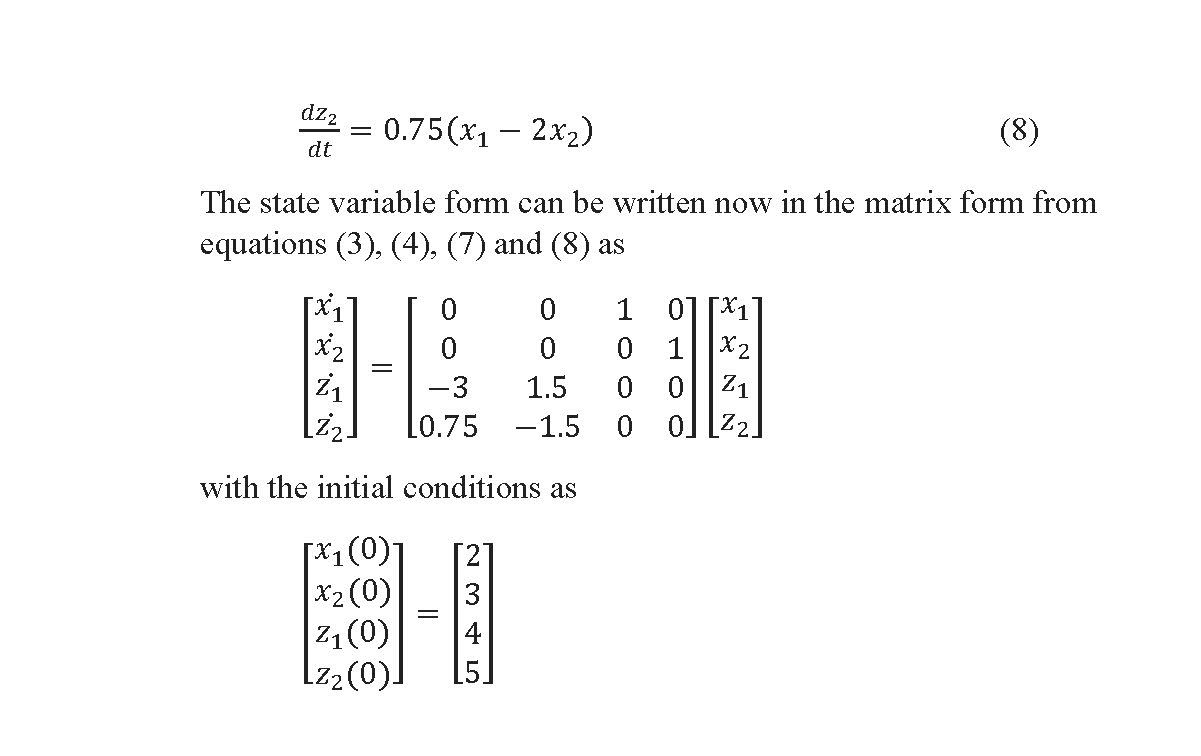
Reducing ordinary differential equations to state variable matrix form

To be able to solve differential equations numerically, one has to reduce them to a set of first order ordinary differential equations – also called the state variable form.  By writing them in a matrix form, the equations become conducive for programming in languages such as MATLAB.  Here is an example of this reduction to state variable matrix form.

08.05 blog_Page_1

08.05 blog_Page_2

This post is brought to you by


How do I do spline interpolation in MATLAB?

Many students ask me how do I do this or that in MATLAB.  So I thought why not have a small series of my next few blogs do that.  In this blog, I show you how to conduct spline interpolation.

  • The MATLAB program link is here.
  • The HTML version of the MATLAB program is here.
  • DO NOT COPY AND PASTE THE PROGRAM BELOW BECAUSE THE SINGLE QUOTES DO NOT TRANSLATE TO THE CORRECT SINGLE QUOTES IN MATLAB EDITOR.  DOWNLOAD THE MATLAB PROGRAM INSTEAD

%% HOW DO I DO THAT IN MATLAB SERIES?
% In this series, I am answering questions that students have asked
% me about MATLAB.  Most of the questions relate to a mathematical
% procedure.

%% TOPIC
% How do I do spline interpolation?

%% SUMMARY

% Language : Matlab 2008a;
% Authors : Autar Kaw;
% Mfile available at
% http://nm.mathforcollege.com/blog/interpolate_spline.m;
% Last Revised : June 20, 2009;
% Abstract: This program shows you how to do spline interpolation?
%           .
clc
clear all
clf

%% INTRODUCTION

disp(‘ABSTRACT’)
disp(‘   This program shows you how to do spline interpolation?’)
disp(‘ ‘)
disp(‘AUTHOR’)
disp(‘   Autar K Kaw of http://autarkaw.wordpress.com’)
disp(‘ ‘)
disp(‘MFILE SOURCE’)
disp(‘   http://nm.mathforcollege.com/blog/interpolation_spline.m’)
disp(‘ ‘)
disp(‘LAST REVISED’)
disp(‘   June 20, 2009’)
disp(‘ ‘)

%% INPUTS
% y vs x data to interpolate
% x data
x=[-1  -0.75  -0.5  -0.25   0.25  0.50 0.75  1];
% ydata
y=[-0.5  -0.5  -0.5  -0.5   0.5  0.5  0.5  0.5];
% Where do you want to interpolate at
xin=[-0.8  -0.7  0.7  0.8];
%% DISPLAYING INPUTS
disp(‘INPUTS’)
disp(‘The x data’)
x
disp(‘The y data’)
y
disp(‘The x values where you want to find the interpolated values’)
xin
disp(‘  ‘)

%% THE CODE
% Fitting to spline – it is cubic splines
yin=spline(x,y,xin);
% This is only for plotting the spline interpolants
% Find the number of data points
n=length(x);
xplot=x(1):(x(n)-x(1))/10000:x(n);
yplot=spline(x,y,xplot);

%% DISPLAYING OUTPUTS
disp(‘  ‘)
disp(‘OUTPUTS’)
disp(‘x values at which function is to be interpolated’)
xin
disp(‘y values at the xin values’)
yin
xlabel(‘x’);
ylabel(‘y’);
title(‘y vs x ‘);
plot(x,y,’o’,’MarkerSize’,10,’MarkerEdgeColor’,’b’,’MarkerFaceColor’,’b’)
hold on
plot(xin,yin,’o’,’MarkerSize’,10,’MarkerEdgeColor’,’r’,’MarkerFaceColor’,’r’)
hold on
plot(xplot,yplot,’LineWidth’,2)
legend(‘Points given’,’Points found’,’Spline Curve’,’Location’,’East’)
hold off
disp(‘  ‘)

This post is brought to you by Holistic Numerical Methods: Numerical Methods for the STEM undergraduate at http://nm.mathforcollege.com, the textbook on Numerical Methods with Applications available from the lulu storefront, and the YouTube video lectures available at http://nm.mathforcollege.com/videos and http://www.youtube.com/numericalmethodsguy

Subscribe to the blog via a reader or email to stay updated with this blog. Let the information follow you.
How do I do polynomial interpolation in MATLAB

Many students ask me how do I do this or that in MATLAB.  So I thought why not have a small series of my next few blogs do that.  In this blog, I show you how to do polynomial interpolation.

  • The MATLAB program link is here.
  • The HTML version of the MATLAB program is here.
  • DO NOT COPY AND PASTE THE PROGRAM BELOW BECAUSE THE SINGLE QUOTES DO NOT TRANSLATE TO THE CORRECT SINGLE QUOTES IN MATLAB EDITOR.  DOWNLOAD THE MATLAB PROGRAM INSTEAD

%% HOW DO I DO THAT IN MATLAB SERIES?
% In this series, I am answering questions that students have asked
% me about MATLAB.  Most of the questions relate to a mathematical
% procedure.

%% TOPIC
% How do I do polynomial interpolation?

%% SUMMARY

% Language : Matlab 2008a;
% Authors : Autar Kaw;
% Mfile available at
% http://nm.mathforcollege.com/blog/interpolate_polynomial.m;
% Last Revised : June 10, 2009;
% Abstract: This program shows you how to do polynomial interpolation?
%           .
clc
clear all
clf

%% INTRODUCTION

disp(‘ABSTRACT’)
disp(‘   This program shows you how to do polynomial interpolation?’)
disp(‘ ‘)
disp(‘AUTHOR’)
disp(‘   Autar K Kaw of http://autarkaw.wordpress.com’)
disp(‘ ‘)
disp(‘MFILE SOURCE’)
disp(‘   http://nm.mathforcollege.com/blog/interpolation_polynomial.m’)
disp(‘ ‘)
disp(‘LAST REVISED’)
disp(‘   June 10, 2009’)
disp(‘ ‘)

%% INPUTS
% y vs x data to interpolate
% x data
x=[-1  -0.6  -0.2  0.2  0.6  1];
% ydata
y=[0.0385    0.1000    0.5000    0.5000    0.1000    0.0385];
% Where do you want to interpolate at
xin=[-0.8  -0.7  0.7  0.8];
%% DISPLAYING INPUTS
disp(‘INPUTS’)
disp(‘The x data’)
x
disp(‘The y data’)
y
disp(‘The x values where you want to find the interpolated values’)
xin
disp(‘  ‘)

%% THE CODE
% Find the number of data points
n=length(x);
% Fitting to polynomial of order m=n-1
m=n-1
% pp consists of the coefficients of the polynomial
% pp(1)*x^m+pp(2)*x^m+…….+pp(m)
% pp(1) is coefficient of x^m
% pp(2) is coefficient of x^(m-1)
% and so on
pp=polyfit(x,y,m);
% Getting the values at xin
yin=polyval(pp,xin);
% This is only for plotting the interpolating polynomial
xplot=x(1):(x(n)-x(1))/10000:x(n);
yplot=polyval(pp,xplot);

%% DISPLAYING OUTPUTS
disp(‘  ‘)
disp(‘OUTPUTS’)
disp(‘x values at which function is to be interpolated’)
xin
disp(‘y values at the xin values’)
yin
disp(‘These are the coefficients of the polynomial interpolant’)
disp(‘pp(1) is coefficient of x^m, pp(2) is coefficient of x^(m-1) and so on’)
fprintf(‘Order of polynomial m =%g’,m)
pp
xlabel(‘x’);
ylabel(‘y’);
title(‘y vs x ‘);
plot(x,y,’o’,’MarkerSize’,10,’MarkerEdgeColor’,’b’,’MarkerFaceColor’,’b’)
hold on
plot(xin,yin,’o’,’MarkerSize’,10,’MarkerEdgeColor’,’k’,’MarkerFaceColor’,’k’)
hold on
plot(xplot,yplot,’LineWidth’,2)
legend(‘Points given’,’Points found’,’Polynomial Curve’)
hold off
disp(‘  ‘)

This post is brought to you by Holistic Numerical Methods: Numerical Methods for the STEM undergraduate at http://nm.mathforcollege.com, the textbook on Numerical Methods with Applications available from the lulu storefront, and the YouTube video lectures available at http://nm.mathforcollege.com/videos and http://www.youtube.com/numericalmethodsguy

Subscribe to the blog via a reader or email to stay updated with this blog. Let the information follow you.

MATLAB code for the efficient automatic integrator

In the previous post, we discussed why doubling the number of segments in the automatic integrator based on multiple-segment trapezoidal rule is more efficient than increasing the number of segments one at a time. But this advantage involves having to store the individual function values from previous calculations and then having to retrieve them properly. This drawback was circumvented very efficiently by using the formula derived in another previous post where there is no need to store individual function values.

The matlab file for finding a definite integral by directly using the multiple segment trapezoidal rule from this post is given here (matlab file, html file), while the matlab file that uses the more efficient formula from this post is given here (matlab file, html file).  Here are the inputs to the programs.

% a = Lower limit of integration
% b = Upper limit of integration
%  nmax = Maximum number of segments
% tolerance = pre-specified tolerance in percentage
% f = inline function as integrand

a=5.3;
b=10.7;
nmax=200000;
tolerance=0.000005;
f=inline(‘exp(x)*sin(2*x)’)

We ran both the program on a PC and found that the more efficient algorithm (51 seconds) ran in half the time as the other one (82 seconds).  This is expected, as only n function evaluations are made for 2n-segments rule with the efficient formula, while 2n+1 functions evaluations are made for the original formula.

This post is brought to you by Holistic Numerical Methods: Numerical Methods for the STEM undergraduate at http://nm.mathforcollege.com, the textbook on Numerical Methods with Applications available from the lulu storefront, and the YouTube video lectures available at http://www.youtube.com/numericalmethodsguy.

Subscribe to the blog via a reader or email to stay updated with this blog. Let the information follow you.

A Matlab program for comparing Runge-Kutta methods

In a previous post, we compared the results from various 2nd order Runge-Kutta methods to solve a first order ordinary differential equation. In this post, I am posting the matlab program. It is better to download the program as single quotes in the pasted version do not translate properly when pasted into a mfile editor of MATLAB or see the html version for clarity and sample output .

Do your own testing on a different ODE, a different value of step size, a different initial condition, etc. See the inputs section below that is colored in bold brick.

% Simulation : Comparing the Runge Kutta 2nd order method of
% solving ODEs
% Language : Matlab 2007a
% Authors : Autar Kaw
% Last Revised : July 12, 2008
% Abstract: This program compares results from the
% exact solution to 2nd order Runge-Kutta methods
% of Heun’s method, Ralston’s method, Improved Polygon
% method, and directly using the three terms of Taylor series
clc
clear all
clc
clf
disp(‘This program compares results from the’)
disp(‘exact solution to 2nd order Runge-Kutta methods’)
disp(‘of Heuns method, Ralstons method, Improved Polygon’)
disp(‘ method, and directly using the three terms of Taylor series’)

%INPUTS. If you want to experiment these are only things
% you should and can change. Be sure that the ode has an exact
% solution
% Enter the rhs of the ode of form dy/dx=f(x,y)
fcnstr=’sin(5*x)-0.4*y’ ;
% Initial value of x
x0=0;
% Initial value of y
y0=5;
% Final value of y
xf=5.5;
% number of steps to go from x0 to xf.
% This determines step size h=(xf-x0)/n
n=10;


%REST OF PROGRAM
%Converting the input function to that can be used
f=inline(fcnstr) ;

% EXACT SOLUTION
syms x
eqn=[‘Dy=’ fcnstr]
% exact solution of the ode
exact_solution=dsolve(eqn,’y(0)=5′,’x’)
% geting points for plotting the exact solution
xx=x0:(xf-x0)/100:xf;
yy=subs(exact_solution,x,xx);
yexact=subs(exact_solution,x,xf);
plot(xx,yy,’.’)
hold on

% RUNGE-KUTTA METHODS
h=(xf-x0)/n;
% Heun’s method
a1=0.5;
a2=0.5;
p1=1;
q11=1;
xr=zeros(1,n+1);
yr=zeros(1,n+1);
%Initial values of x and y
xr(1)=x0;
yr(1)=y0;
for i=1:1:n
k1=f(xr(i),yr(i));
k2=f(xr(i)+p1*h,yr(i)+q11*k1*h);
yr(i+1)=yr(i)+(a1*k1+a2*k2)*h;
xr(i+1)=xr(i)+h;
end
%Value of y at x=xf
y_heun=yr(n+1);
% Absolute relative true error for value using Heun’s Method
et_heun=abs((y_heun-yexact)/yexact)*100;
hold on
xlabel(‘x’)
ylabel(‘y’)
title_name=[‘Comparing exact and Runge-Kutta methods with h=’ num2str(h)] ;
title(title_name)
plot(xr,yr, ‘color’,’magenta’,’LineWidth’,2)
% Midpoint Method (also called Improved Polygon Method)
a1=0;
a2=1;
p1=1/2;
q11=1/2;
%Initial values of x and y
xr(1)=x0;
yr(1)=y0;
for i=1:1:n
k1=f(xr(i),yr(i));
k2=f(xr(i)+p1*h,yr(i)+q11*k1*h);
yr(i+1)=yr(i)+(a1*k1+a2*k2)*h;
xr(i+1)=xr(i)+h;
end
%Value of y at x=xf
y_improved=yr(n+1);
% Absolute relative true error for value using Improved Polygon Method
et_improved=abs((y_improved-yexact)/yexact)*100;
hold on
plot(xr,yr,’color’,’red’,’LineWidth’,2)

% Ralston’s method
a1=1/3;
a2=2/3;
p1=3/4;
q11=3/4;
xr(1)=x0;
yr(1)=y0;
for i=1:1:n
k1=f(xr(i),yr(i));
k2=f(xr(i)+p1*h,yr(i)+q11*k1*h);
yr(i+1)=yr(i)+(a1*k1+a2*k2)*h;
xr(i+1)=xr(i)+h;
end
%Value of y at x=xf
y_ralston=yr(n+1);
% Absolute relative true error for value using Ralston’s Method
et_ralston=abs((y_ralston-yexact)/yexact)*100;
hold on
plot(xr,yr,’color’,’green’,’LineWidth’,2)

% Using first three terms of the Taylor series
syms x y;
fs=char(fcnstr);
% fsp=calculating f'(x,y) using chain rule
fsp=diff(fs,x)+diff(fs,y)*fs;
%Initial values of x and y
xr(1)=x0;
yr(1)=y0;
for i=1:1:n
k1=subs(fs,{x,y},{xr(i),yr(i)});
kk1=subs(fsp,{x,y},{xr(i),yr(i)});
yr(i+1)=yr(i)+k1*h+1/2*kk1*h^2;
xr(i+1)=xr(i)+h;
end
%Value of y at x=xf
y_taylor=yr(n+1);
% Absolute relative true error for value using Taylor series
et_taylor=abs((y_taylor-yexact)/yexact)*100;
hold on
plot(xr,yr,’color’,’black’,’LineWidth’,2)
hold off
legend(‘exact’,’heun’,’midpoint’,’ralston’,’taylor’,1)

% THE OUTPUT
fprintf(‘\nAt x = %g ‘,xf)
disp(‘ ‘)
disp(‘_________________________________________________________________’)
disp(‘Method Value Absolute Relative True Error’)
disp(‘_________________________________________________________________’)
fprintf(‘\nExact Solution %g’,yexact)
fprintf(‘\nHeuns Method %g %g ‘,y_heun,et_heun)
fprintf(‘\nImproved method %g %g ‘,y_improved,et_improved)
fprintf(‘\nRalston method %g %g ‘,y_ralston,et_ralston)
fprintf(‘\nTaylor method %g %g ‘,y_taylor,et_taylor)
disp( ‘ ‘)

________________________________________________________________________________________________

This post is brought to you by Holistic Numerical Methods: Numerical Methods for the STEM undergraduate at http://nm.mathforcollege.com

Subscribe to the blog via a reader or email to stay updated with this blog. Let the information follow you.