How do I do that in MATLAB

HOW DO I DO THAT IN MATLAB SERIES?

Sum of the residuals for the linear regression model is zero.

Prove that the sum of the residuals for the linear regression model is zero.sum of residuals is zero Page 1sum of residuals is zero Page 2________________________________________________

This post is brought to you by

Prove that the least squares general straight-line model gives the absolute minimum of the sum of the squares of the residuals?

Many regression models when derived in books only show the first derivative test to find the formulas for the constants of a linear regression model.  Here we show a thoroughly explained derivation.


___________________________________________

This post is brought to you by Holistic Numerical Methods: Numerical Methods for the STEM undergraduate at http://nm.mathforcollege.com, the textbook on Numerical Methods with Applications available from the lulu storefront, the textbook on Introduction to Programming Concepts Using MATLAB, and the YouTube video lectures available at http://nm.mathforcollege.com/videos.  Subscribe to the blog via a reader or email to stay updated with this blog. Let the information follow you.

Effect of Significant Digits: Example 2: Regression Formatting in Excel

In a series of bringing pragmatic examples of the effect of significant digits, we discuss the influence of using default and scientific formats in the trendline function of Microsoft Excel.  This is the second example (first example was on a beam deflection problem) in the series.

____________________________________________

This post is brought to you by Holistic Numerical Methods: Numerical Methods for the STEM undergraduate at http://nm.mathforcollege.com, the textbook on Numerical Methods with Applications available from the lulu storefront, the textbook on Introduction to Programming Concepts Using MATLAB, and the YouTube video lectures available at http://nm.mathforcollege.com/videos.  Subscribe to the blog via a reader or email to stay updated with this blog. Let the information follow you.

Does the solve command in MATLAB not give you an answer?

Recently, I had assigned a project to my class where they needed to regress n number of x-y data points to a nonlinear regression model y=exp(b*x).  However, they were NOT allowed to transform the data, that is, transform data such that linear regression formulas can be used to find the constant of regression b.  They had to do it the new-fashioned way: Find the sum of the square of the residuals and then minimize the sum with respect to the constant of regression b.

To do this, they conducted the following steps

  1. setup the equation by declaring b as a syms variable,
  2. calculate the sum  of the square of the residuals using a loop,
  3. use the diff command to set up the equation,
  4. use the solve command. 

However, the solve command gave some odd answer like log(z1)/5 + (2*pi*k*i)/5.  The students knew that the equation has only one real solution – this was deduced from the physics of the problem. 

We did not want to set up a separate function mfile to use the numerical solvers such as fsolve.  To circumvent the setting up of a separate function mfile, we approached it as follows.  If dbsr=0 is the equation you want to solve, use

F = vectorize(inline(char(dbsr)))
fsolve(F, -2.0)

What char command does is to convert the function dbsr to a string, inline constructs it to an inline function, vectorize command vectorizes the formula (I do not fully understand this last part myself or whether it is needed).

This post is brought to you by Holistic Numerical Methods: Numerical Methods for the STEM undergraduate at http://nm.mathforcollege.com, the textbook on Numerical Methods with Applications available from the lulu storefront, the textbook on Introduction to Programming Concepts Using MATLAB, and the YouTube video lectures available athttp://nm.mathforcollege.com/videos.  Subscribe to the blog via a reader or email to stay updated with this blog. Let the information follow you.

Does it make a large difference if we transform data for nonlinear regression models

__________________________________________________

This post is brought to you by Holistic Numerical Methods: Numerical Methods for the STEM undergraduate at http://nm.mathforcollege.com, the textbook on Numerical Methods with Applications available from the lulu storefront, and the YouTube video lectures available at http://nm.mathforcollege.com/videos and http://www.youtube.com/numericalmethodsguy

Subscribe to the blog via a reader or email to stay updated with this blog. Let the information follow you.

To prove that the regression model corresponds to a minimum of the sum of the square of the residuals

Many regression models when derived in books only show the first derivative test to find the formulas for the constants of a regression model.  Here we take a  simple example to go through the complete derivation.

Finding minimum of sum of square of residuals

Minimum of sum of square of residuals

_________________________________________________________

This post is brought to you by Holistic Numerical Methods: Numerical Methods for the STEM undergraduate at http://nm.mathforcollege.com, the textbook on Numerical Methods with Applications available from the lulu storefront, and the YouTube video lectures available at http://nm.mathforcollege.com/videos and http://www.youtube.com/numericalmethodsguy

Subscribe to the blog via a reader or email to stay updated with this blog. Let the information follow you.

Finding height of atmosphere using nonlinear regression

Here is an example of finding the height of the atmosphere using nonlinear regression of the mass density of air vs altitude above sea level.

This post is brought to you by Holistic Numerical Methods: Numerical Methods for the STEM undergraduate at http://nm.mathforcollege.com.

An abridged (for low cost) book on Numerical Methods with Applications will be in print (includes problem sets, TOC, index) on December 10, 2008 and available at lulu storefront.

Subscribe to the blog via a reader or email to stay updated with this blog. Let the information follow you.

Abuses of regression

There are three common abuses of regression analysis.

  1. Extrapolation
  2. Generalization
  3. Causation.

Extrapolation

If you were dealing in the stock market or even interested in it, we remember the stock market crash of March 2000. During 1997-1999, many investors thought they would double their money every year, started buying fancy cars and houses on credit, and living the high life. Little did they know that the whole market was hyped on speculation and little economic sense? Enron and MCI financial fiascos were soon to follow.

Let us look if we could have safely extrapolated NASDAQ index from past years. Below is the table of NASDAQ index, S as a function of end of year number, t (Year 1 is the end of year 1994, and Year 6 is the end of year 1999).

Table 1 NASDAQ index as a function of year number.

Year Number (t)

NASDAQ Index (S)

1 (1994)

752

2 (1995)

1052

3 (1996)

1291

4 (1997)

1570

5 (1998)

2193

6 (1999)

4069

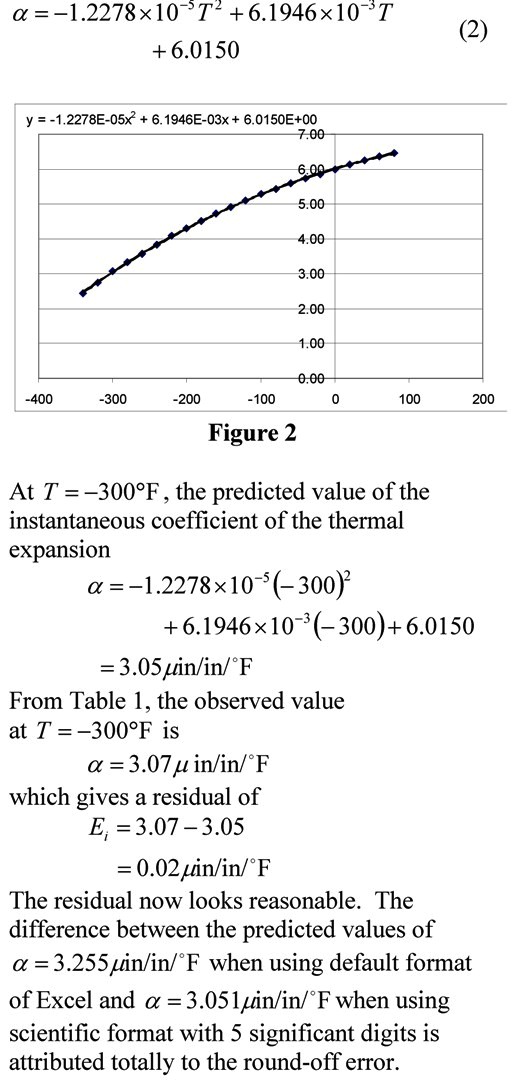
A relationship S = a0+a1t+a2t2 between the NASDAQ index, S and the year number, t is developed using least square regression and is found to be

S=168.14t2 – 597.35t + 1361.8

The data is given for Years 1 thru 6 and it is desired to calculate the value for t>=6. This is extrapolation outside the model data. The error inherent in this model is shown in Table 2. Look at the Year 7 and 8 that was not included in the regression data – the error between the predicted and actual values is 119% and 277%, respectively.

 Table 2 NASDAQ index as a function of year number.

Year Number

(t)

NASDAQ Index

(S)

Predicted Index

Absolute Relative True Error (%)

1 (1994)

752

933

24

2 (1995)

1052

840

20

3 (1996)

1291

1082

16

4 (1997)

1570

1663

6

5 (1998)

2193

2578

18

6 (1999)

4069

3831

6

7 (2000)

2471

5419

119

8 (2001)

1951

7344

277

This illustration is not exaggerated and it is important that a careful use of any given model equations is always called for. At all times, it is imperative to infer the domain of independent variables for which a given equation is valid.


Generalization

Generalization could arise when unsupported or overexaggerated claims are made. It is not often possible to measure all predictor variables relevant in a study. For example, a study carried out about the behavior of men might have inadvertently restricted the survey to Caucasian men. Shall we then generalize the result as the attributes of all men irrespective of race? Such use of regression equation is an abuse since the limitations imposed by the data restrict the use of the prediction equations to Caucasian men.


Misidentification

Finally, misidentification of causation is a classic abuse of regression analysis equations. Regression analysis can only aid in the confirmation or refutation of a causal model ‑ the model must however have a theoretical basis. In a chemical reacting system in which two species react to form a product, the amount of product formed or amount of reacting species vary with time. Although a regression equation of species concentration and time can be obtained, one cannot attribute time as the causal agent for the varying species concentration. Regression analysis cannot prove causality; rather they can only substantiate or contradict causal assumptions. Anything outside this is an abuse of the use of regression analysis method.

This post used textbook notes written by the author and Egwu Kalu, Professor of Chemical and Biomedical Engineering, FAMU, Tallahassee, FL.

____________________________________________________

This post is brought to you by Holistic Numerical Methods: Numerical Methods for the STEM undergraduate at http://nm.mathforcollege.com

Subscribe to the blog via a reader or email to stay updated with this blog. Let the information follow you.


How do you know that the least squares regression line is unique and corresponds to a minimum

We already know that using the criterion of either

  1. minimizing sum of residuals OR
  2. minimizing sum of the absolute value of residuals

is BAD as either of the criteria do not give a unique line. Visit these notes for an example where these criteria are shown to be inadequate.

So we use minimizing the sum of the squares of the residuals as the criterion. How can we show that this criterion gives a unique line?

The proof is given below as image files because the proof is equation intensive. I made a better resolution pdf file also.


_____________________________________________________

This post is brought to you by Holistic Numerical Methods: Numerical Methods for the STEM undergraduate at http://nm.mathforcollege.com

Subscribe to the blog via a reader or email to stay updated with this blog. Let the information follow you.