Getting last name and first name from full name with a delimited comma

Rather than using the “text to columns” procedure in excel, if you want to use a function to separate the last name and the first name for simplicity of use and the ability to copy the functionality anywhere, here are two functions that are written for you.

I wrote these functions because CANVAS LMS does not have separate columns for first and last names in the grade book.   However, they do have an option of showing the full name delimited by a comma.  This is preserved when you export the GradeBook.

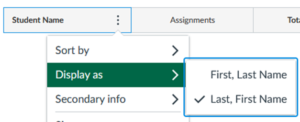
Figure 1: Display name as separated by commas.

To use them, press Alt-F11.  It will open up the Microsoft Visual Basic for Applications window.  Choose Insert>Module.  It will show up as Module1 by default in the VBA Project window.  Good to rename the module to say “LastFirstNameBreak” using the Properties Window.  Cut and paste the two functions in the module, and save your excel file.  You will need to save the excel file as an .xslm file though.

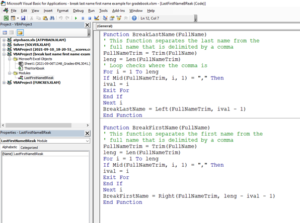
Figure 2. Microsoft VBA Window.  Functions are shown below.

Function BreakLastName(FullName)
' This function separates the last name from the
' full name that is delimited by a comma
FullNameTrim = Trim(FullName)
leng = Len(FullNameTrim)
' Loop checks where the comma is
For i = 1 To leng
If Mid(FullNameTrim, i, 1) = "," Then
ival = i
Exit For
End If
Next i
BreakLastName = Left(FullNameTrim, ival - 1)
End Function
Function BreakFirstName(FullName)
' This function separates the first name from the
' full name that is delimited by a comma
FullNameTrim = Trim(FullName)
leng = Len(FullNameTrim)
For i = 1 To leng
If Mid(FullNameTrim, i, 1) = "," Then
ival = i
Exit For
End If
Next i
BreakFirstName = Right(FullNameTrim, leng - ival - 1)
End Function

To use the functions, just use them like any other Excel function.  BreakLastName separates the last name, while BreakFirstName separates the first name.

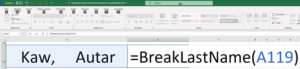
Figure 3. Using the functions in an Excel spreadsheet.

____________________________

This post is brought to you by

Converting a date to acceptable format in excel

Currently, I am using Smart Sparrow to collect data for the effectiveness of using adaptive learning platforms to improve the pre-class experience of flipped learning.

Amongst the data, I want to collect is when a student completes the lesson.  If the student is completing the lesson too close to the deadline, his/her data needs to be interpreted differently than the one from who does it within a reasonable time frame.  The latter would help me to better address how the lesson can be improved as a student.  A student racing against the deadline would give unreliable data on how a lesson can be improved.

Smart Sparrow does track the time when a student completes the lesson but the format is as follows.

Dayth Month Year, Hour:Minute AM/PM format (e.g. 7th Sep 2017, 9:40am).

The data is downloadable as in a CSV format.  Unfortunately, they do not give day/time since epoch or in acceptable excel format to find the time difference between when the lesson was completed and the lesson deadline.  So I wrote a VBA module function ‘changedate’ to do this.  Here it is.

function changedate (DateTimeOriginal)
‘This program converts a date/time given in XXth Month Year, Time format
‘Example 19th Sep 2017, 9:40 am
‘to be converted to
’09/19/2017 9:40am
‘to acceptable excel format to subtract from other dates
‘declaring a 12 element long vector for months
Dim monthvector(11) As String
monthvector(0) = “JAN”
monthvector(1) = “FEB”
monthvector(2) = “MAR”
monthvector(3) = “APR”
monthvector(4) = “MAY”
monthvector(5) = “JUN”
monthvector(6) = “JUL”
monthvector(7) = “AUG”
monthvector(8) = “SEP”
monthvector(9) = “OCT”
monthvector(10) = “NOV”
monthvector(11) = “DEC”
‘Uppercasing the date for accurate comparison
DateTimeOriginal = UCase(Trim(DateTimeOriginal))
‘Length of input date

‘Adding a 0 in front if day of month is between 1-9 so that the
‘length of string is same for all dates
If IsNumeric(Mid(DateTimeOriginal, 2, 1)) = False Then DateTimeOriginal = “0” + DateTimeOriginal

‘Capturing Day Number
daynumber = Mid(DateTimeOriginal, 1, 2)

‘Capturing the Year
yearnumber = Mid(DateTimeOriginal, 10, 4)

‘Capturing the Month
For i = 1 To 12
If Mid(DateTimeOriginal, 6, 3) = (monthvector(i – 1)) Then
monthnumber = Str(i)
End If
Next

‘Capturing time of day
timenumber = Right(DateTimeOriginal, 8)

‘Writing the date in acceptable format
changedate = monthnumber + “/” + daynumber + “/” + yearnumber + ” ” + timenumber
changedate = Trim(changedate)
End Function

______________________________________________________________________________

End of semester grading VBA module

In spite of learning management systems making assigning letter grades simpler, these systems still leave much to be desired when asked to incorporate extra credit or curving of an assessment grade.  To overcome this drawback, I download the grades to a excel spreadsheet and calculate the overall score of each student.  Based on the overall score, one needs to then assign a letter grade for the transcripts.  To assign 13 different plus/minus grading letters manually can be a good candidate for making a mistake in a large size class.  So I use a VBA code (how to access VBA editor) to assign letter grades.

INPUTS AND OUTPUTS
c1 = overall percentage score
fungrade = letter grade

CITATION
Autar Kaw, End of semester grading VBA module, last retrieved at https://autarkaw.wordpress.com/2015/12/21/end-of-semester-grading-vba-module/, December 21, 2015.

FUNCTION 
Function fungrade (c1 As Integer) As String
Dim gra As String
Select Case c1
Case Is >= 98
gra = “A+”
Case Is >= 90
gra = “A”
Case Is >= 86
gra = “A-”
Case Is >= 83
gra = “B+”
Case Is >= 80
gra = “B”
Case Is >= 76
gra = “B-”
Case Is >= 73
gra = “C+”
Case Is >= 70
gra = “C”
Case Is >= 66
gra = “C-”
Case Is >= 63
gra = “D+”
Case Is >= 60
gra = “D”
Case Is >= 56
gra = “D-”
Case Is >= 0
gra = “F”
End Select
fungrade = gra
End Function

PS. You can modify the above given VBA code as needed.  If you want a less hard-coded version, you can modify by having two more inputs – 1) a vector of lowest limit of score for a particular letter grade, and 2) a corresponding vector of the same length of letter grades.

This post is brought to you by

Effect of Significant Digits: Example 2: Regression Formatting in Excel

In a series of bringing pragmatic examples of the effect of significant digits, we discuss the influence of using default and scientific formats in the trendline function of Microsoft Excel.  This is the second example (first example was on a beam deflection problem) in the series.

____________________________________________

This post is brought to you by Holistic Numerical Methods: Numerical Methods for the STEM undergraduate at http://nm.mathforcollege.com, the textbook on Numerical Methods with Applications available from the lulu storefront, the textbook on Introduction to Programming Concepts Using MATLAB, and the YouTube video lectures available at http://nm.mathforcollege.com/videos.  Subscribe to the blog via a reader or email to stay updated with this blog. Let the information follow you.

Reading an excel file in MATLAB

Recently I taught a volunteer class to professional engineers on MATLAB.  Two of the most requested items of interest were
1. How do I read an excel file?
2. How do I do curve fitting?

We address the first question here.  It is easy to read an excel file with the xlsread command but what do you with it once the file has been assigned.  So we took a simple example of an excel spreadsheet where the first column consists of a student number and the second column has the examination scores of the students.  You are asked to find the highest score.

The MATLAB program link is here.
The HTML version of the MATLAB program is here.
The Excel file used in the MATLAB program is here

It is better to download (right click and save target) the program as single quotes in the pasted version do not translate properly when pasted into a mfile editor of MATLAB or you can read the html version for clarity and sample output.

%% READING AN EXCEL SPREADSHEET IN MATLAB
% Language : Matlab 2008a
% Authors : Autar Kaw
% Last Revised : December 12, 2010
% Abstract: This program shows you how to read an excel file in MATLAB
% The example has student numbers in first column and their score in the
% second column
clc
clear all
disp(‘This program shows how to read an excel file in MATLAB’)
disp(‘Matlab 2008a’)
disp(‘Authors : Autar Kaw’)
disp(‘Last Revised : December 12, 2010’)
disp(‘http://nm.mathforcollege.com’)
disp(‘  ‘)

%% INPUTS
% We have two column data and it has headers in the first row.
% That is why we read the data from A2 to B32.
A=xlsread(‘c:\users\grades.xls’,’A2:B32′);
disp (‘The data read from the excel spreadsheet is’)
disp(A)
disp(‘  ‘)
%% SOLUTION
% Finding the number of rows and columns
sizem=size(A);
rows_A=sizem(1);
cols_A=sizem(2);
% Assigning the scores to a vector called score
for i=1:1:rows_A
    score(i)=A(i,2);
end
% Using the max command to find the maximum score
% HW: Write your own function “max”
maxscore=max(score);
% Finding which student got the highest score
for i=1:1:rows_A
   if score(i)==maxscore
       student_no=i;
       break;
   end
 % HW: What if more than one student scored the highest grade??
end
%% OUTPUT
disp(‘  ‘)
disp (‘OUTPUT’)
fprintf(‘Student Number# %g scored the maximum score of %g’,…
    student_no,maxscore)
disp(‘ ‘)

This post is brought to you by

Subscribe to the blog via a reader or email to stay updated with this blog. Let the information follow you.