Balancing the social mobility index and reputation rankings

Autar Kaw
December 19, 2022

Social mobility is becoming ever so popular a criterion to evaluate university education.  However, we all know that reputation of university matters as well because it attracts high-caliber students, faculty, and staff, and hence presumably, the quality of education and opportunity of high impact practices, such as research experiences, internships, cooperative education, and capstone courses.

I wanted to see how well my university – the University of South Florida (USF), balances the two issues of social mobility and reputation.  USF is a Carnegie R1 institution, meaning that it is categorized as a university with “very high research activity”.  There are 146 R1 universities, amongst which 106 (actually, there are 107 but one of them Graduate Center, CUNY only admits graduate students) are public.

This blog is limited to the Carnegie R1 public universities.  I gave the same weight to the two rankings US News and World Report ranking and the Economic Mobility Index ranking .   The US News and World Report ranking  mostly use reputation in its calculations, and other factors include graduation and retention rates, selectivity of the incoming class, alumni giving rate, etc., which are substantially influenced by the wealth and income of the student’s family. The Economic Mobility Index ranking measures social mobility via out-of-pocket expenses, salary boost due to college degree, and time after graduation to recoup the money spent to go to college.

The weighted ranking is not hard science, but it gives us a glimpse of where we stand.  We at the University of South Florida are No. 17 out of 106 public Carnegie Research 1 universities.  Seven of the top 10 universities belong to the University of California system, while Florida is not far behind, holding the spots at 11, 13, 17, 22, and 25 in this combined ranking system.

University of California, Irvine 1
University of California, San Diego 2
University of Illinois Urbana-Champaign 3
University of California, Davis 4
University of California, Los Angeles 5
University of California, Santa Barbara 6
University of Texas at Austin 7
Rutgers University–New Brunswick 8
University of California, Berkeley 9
University of California, Riverside 10
University of Florida 11
University of Illinois Chicago 12
Florida State University 13
Stony Brook University 14
New Jersey Institute of Technology 15
University of North Carolina at Chapel Hill 16
University of South Florida 17
University of California, Santa Cruz 18
University at Buffalo 19
University of Washington 20
University of Connecticut 21
Florida International University 22
Arizona State University Campus Immersion 23
Binghamton University 24
University of Central Florida 25
Ohio State University 26
University of Georgia 27
University of Arizona 28
University of Michigan 29
University of Houston 30
Texas A&M University 31
Michigan State University 32
Georgia State University 33
University at Albany, SUNY 34
University of Colorado Denver 35
Wayne State University 36
University of Texas at Dallas 37
University of Maryland, Baltimore County 38
Temple University 39
George Mason University 40
North Carolina State University 41
University of Utah 42
University of Tennessee 43
University of Maryland, College Park 44
University of Minnesota 45
Indiana University Bloomington 46
University of Virginia 47
University of Alabama at Birmingham 48
University of Wisconsin–Madison 49
University of Iowa 50
University of Texas at El Paso 51
University of Massachusetts Amherst 52
Purdue University 53
University of Oregon 54
Georgia Institute of Technology 55
University of Texas at San Antonio 56
University of Pittsburgh 57
Washington State University 58
Virginia Tech 59
University of North Texas 60
Ohio University 61
University of Nevada, Las Vegas 62
University of Memphis 63
Utah State University 64
University of Hawaii at Manoa 65
Oklahoma State University–Stillwater 66
Pennsylvania State University 67
University of Texas at Arlington 68
University of Kansas 69
University of Kentucky 70
University of Oklahoma 71
University of Missouri 72
University of South Carolina 73
Clemson University 74
Oregon State University 75
University of Louisville 76
Virginia Commonwealth University 77
Old Dominion University 78
Texas Tech University 79
University of Mississippi 80
Iowa State University 81
Colorado School of Mines 82
University of Southern Mississippi 83
University of New Mexico 84
Louisiana State University 85
University of Delaware 86
University of Colorado Boulder 87
University of New Hampshire 88
West Virginia University 89
University of Cincinnati 90
University of Nevada, Reno 91
Auburn University 92
Mississippi State University 93
Colorado State University 94
University of Maine 95
University of Louisiana at Lafayette 96
University of Nebraska–Lincoln 97
University of Wisconsin–Milwaukee 98
Kansas State University 99
University of Arkansas 100
University of Alabama 101
Kent State University 102
University of Alabama in Huntsville 103
University of Montana 104
Montana State University 105
North Dakota State University 106


Autar Kaw is a professor of mechanical engineering at the University of South Florida. He is a recipient of the 2012 U.S. Professor of the Year Award (doctoral and research universities) from the Council for Advancement and Support of Education and the Carnegie Foundation for Advancement of Teaching. His primary scholarly interests are engineering education research, adaptive, blended, and flipped learning, open courseware development, composite materials mechanics, and higher education’s state and future. He has written more than 150 refereed technical papers, and his opinion editorials have appeared in the Tampa Bay Times, the Tampa Tribune, and the Chronicle Vitae.


Integrating functions given at discrete points via MATLAB

When integrating functions given at discrete data points in MATLAB, trapz is the function of choice to go for. But we can get more accurate results by interpolating via cubic splines with the MATLAB spline function.  Since the spline function is made of piecewise cubics, Simpson’s 1/3rd rule can be used to exactly integrate them.   Here is a test program and a function written for you.  You can download the mfile here and a published version here for more readability if you wish.

clc
clear all
% Author: Autar Kaw, AutarKaw.com
% https://creativecommons.org/licenses/by-nc-sa/4.0/ 
% Testing the program with data given at discrete points
% for y=x^6
xx=[1  1.5    2   2.5     3     3.5    4   4.5   5];
yy=[1  1.5^6  2^6 2.5^6   3^6   3.5^6  4^6 4.5^6 5^6];
n=length(xx);
splineintegval=splineintegral(xx,yy);
fprintf('Value of integral using spline =%g',splineintegval)
% Exact value of integral if function was given continuously 
syms x
exact=vpaintegral(x^6,x,xx(1),xx(n));
fprintf('\n Value of integral using exact integration =%g',exact)
%% Function to integrate via spline interpolation
function splineval=splineintegral(x,y)
% This function integrates functions given at discrete data points
% INPUTS
% The x-values are given in ascending order 
% The limits of integration are x(1) to x(n), where n is teh length of
% the x-vector.
% OUTPUTS
% Integral of y dx from x(1) to x(n)
% Author: Autar Kaw, AutarKaw.com 
% https://creativecommons.org/licenses/by-nc-sa/4.0/ 
% The function finds the mid-point value of y between the given 
% x-values at the mid-point. Then since the spline is made of cubics,
% it uses the Simpson's 1/3rd rule to integrate the cubics exactly
n=length(x);
m=n-1;
% Calculating mid-points
    for i=1:1:m
        xmid(i)=(x(i)+x(i+1))*0.5;
    end
% Calculating value of y at the midpoints
polyvalmid=spline(x,y,xmid);
% Using Simpson's 1/3rd rule of integration to integrate cubics
splineval=0;
    for i=1:1:m
        splineval=splineval+(y(i)+y(i+1)+4*polyvalmid(i))*(x(i+1)-x(i))/6;
    end
end

____________________________

This post is brought to you by

Quick Start Guide to OpenMCR Program for a Single Key Exam

Ian Sanders and Autar Kaw


Step 1: Print out the required MCQ sheets
      • 75 Question Variant (Download from here or here)
      • 150 Question Variant (Download from here or here)

Step 2: Conduct the test

Give your printed question paper and the blank MCQ sheet to each of the students.  Ask them to bubble items such as last name, first name, middle name, student id, course number, key code (skip this as it is not necessary), and their answer responses.

A detailed explanation is given here


Step 3: Make the key

To create an answer key, simply print a normal sheet and put 9999999999 in the Student ID field. Fill in the exam with the correct answers.

A detailed explanation is given here

Step 4: Download the program to your PC

Go here https://github.com/iansan5653/open-mcr/releases and download the open-mcr.zip file that is available under assets.  Extract the zip file to the directory of your choice.   One of the files you will see amongst the extracted files is open-mcr.exe. That is the one you need to double-click on to run the program.

A detailed explanation is given here

Step 5:

One of the files you will see amongst the extracted files from Step 2 is open-mcr.exe. That is the one you need to double-click on to run the program.

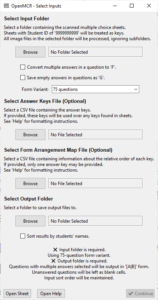
Select the input folder where the images of the MCQ sheets are.

Choose the proper Form Variant as 75 Questions or 150 questions.

Under Select Output Folder, click Browse, and select the folder where you would like to save the resulting CSV files.

Press Continue and watch the progress of the program.

          A detailed explanation is given here


Step 6: Output Files

After the program finishes processing, results will be saved as CSV files in your selected output folder. To get the scores, open the scores csv file with Excel or a text editor.\

          A detailed explanation is given here


A multiple-choice question response reader

Ian Sanders and Autar Kaw

As we are back in face-to-face classes, we may wish to again conduct multiple-choice question examinations in the classroom without the use of computers to alleviate academic integrity concerns, not have to depend on the reliability of the laptop battery and available WiFi, and not have to continue to make different tests every semester.

Background

Commercially available OMR (optical mark recognition) exam sheets, scanners, and processing software can cost educators and educational institutions thousands of dollars per year. In response to this, OpenMCR has been developed as a free and easy-to-use alternative. The tool includes a multiple-choice exam sheet and works with any scanner and printer.

Here are the steps to use the program.


Step 1: Print out the MCQ sheets

Depending on the number of questions being asked, whether it is less than 75 or more (the maximum number of questions that can be asked is 150), you will first choose one of the two pdf files to print.

        • 75 Question Variant (Download the pdf file from here)
        • 150 Question Variant (Download the pdf file from here)

Step 2: Download the program to your PC

Go here https://github.com/iansan5653/open-mcr/releases and download the open-mcr.zip file that is available under assets.  Extract the zip file to the directory of your choice.   One of the files you will see amongst the extracted files is open-mcr.exe. That is the one you need to double-click on to run the program.

For more details about this open resource software, go to https://github.com/iansan5653/open-mcr


Step 3: Choose your variant of the key

In addition to reading scanned images, the software can also automatically score exam results. It does this by comparing the provided keys with the output. There are three options for this, depending on which way you generate your exams:

1. One Exam Variant

This is the most common exam variant.  If you give every exam-taker the exact same exam, you can instruct them to leave the Test Form Code field blank on their sheets. In addition, leave that field blank on the answer key sheet. All exam results will be compared to the single answer key sheet provided. Skip to Step 4 if this is what you chose – no need to create confusion.

2. Shuffled Exam Variants

If you provide the exam-takers with multiple variants of the same exam, and these variants differ only in question order (in other words, each variant is simply shuffled), then you can score all of these with the same key file by providing a file that defines the orders of the shuffled variants.

Each row in this file represents a key, and each column represents the position that that question should be moved to.

For example, if the exam form A has questions 1, 2, and 3, the exam form B might have them in 3, 1, 2 order and C might have them in 3, 2, 1 order. This would result in the following arrangement file:

Test Form Code, Q1, Q2, Q3
             A,  1,  2,  3
             B,  3,  1,  2
             C,  3,  2,  1

If this were the file you upload, then all of the exams with form A would be left untouched while B and C would be rearranged to 1, 2, 3 order. Select the file in the program under the Select Form Arrangement Map.

Note that the first row in this file should always be in 1, 2, 3, … order, and each row after that should only have one instance of each number.

If you use this option, only one exam key can be provided or an error will be raised.

3. Distinct Exam Variants

Finally, you can provide the exam-takers with multiple wholly distinct variants of the same exam. In this case, each exam will be scored by selecting the answer key with an exactly matching Test Form Code. No rearrangement will be performed.


Step 4: Conduct the test

Give the question paper and the blank MCQ sheet to the students.  Ask them to bubble items such as last name, first name, middle name, student id, course number, key code, and their answer responses.


Step 5: Scan the MCQ sheets and the key(s)

If you would like to take advantage of the automatic grading feature of the software, you must provide it with one or more answer keys. To create an answer key, simply print a normal sheet and put 9999999999 in the Student ID field. Also, add a Test Form Code which will be used to match students’ exams with the correct answer key, and finally, fill in the exam with the correct answers.

This is optional – you can choose to just have the software read the exams and not score them.

Scan all the student and key MCQ sheets on a copier or a scanner into a single PDF file.  Use Adobe Acrobat DC or any other freely available program to export the pdf file to images.


Step 6: Run the program

One of the files you will see amongst the extracted files from Step 2 is open-mcr.exe. That is the one you need to double-click on to run the program.

Select the input folder where the images of the MCQ sheets are.

If you select the convert multiple answers in a question to ‘F’ option, then if a student selects, for example, A and B for a question, the output file will save that as F instead of [A|B].

If you select the save empty in questions as ‘G’ option, if a student skips a question by leaving it blank, the output file will save that as G instead of as a blank cell.

Choose the proper Form Variant as 75 Questions or 150 questions.

Under Select Output Folder, click Browse, and select the folder where you would like to save the resulting CSV files.  If you select the sort results by name option, results will be sorted by the students’ last, first, and middle names (in that order). Otherwise, results will be saved in the order they were processed.

Press Continue and watch the progress of the program.


Step 7: Output Files

After the program finishes processing, results will be saved as CSV files in your selected output folder. These files can be opened in Excel or in any text editor. Files will be saved with the time of processing to avoid overwriting any existing files.

If you did not include any answer keys, one raw file will be saved with all of the students’ selected answers, and no scoring is performed.

If you did include one or more answer keys, two more files will be saved in addition to the aforementioned raw file. One of these files will have all of the keys that were found, and the other will have the scored results. In the scored file, questions are saved for each student as either 1 (correct) or 0 (incorrect).


Software License

Copyright (C) 2019-22 Ian Sanders

This program is free software: you can redistribute it and/or modify it under the terms of the GNU General Public License as published by the Free Software Foundation, either version 3 of the License, or (at your option) any later version.

This program is distributed in the hope that it will be useful, but WITHOUT ANY WARRANTY; without even the implied warranty of MERCHANTABILITY or FITNESS FOR A PARTICULAR PURPOSE. See the GNU General Public License for more details.

For the full license text, see license.txt.

Multiple-Choice Sheet License

The multiple-choice sheet distributed with this software is licensed under the Creative Commons Attribution-NonCommercial-ShareAlike 4.0 International license (CC BY-NC-SA 4.0). In summary, this means that you are free to distribute and modify the document so long as you share it under the same license, provide attribution, and do not use it for commercial purposes. For the full license, see the Creative Commons website.

Note: You are explicitly allowed to distribute the multiple-choice sheet without attribution if using it unmodified for educational purposes and not in any way implying that it is your own work. This is an exception to the Creative Commons terms.

Getting last name and first name from full name with a delimited comma

Rather than using the “text to columns” procedure in excel, if you want to use a function to separate the last name and the first name for simplicity of use and the ability to copy the functionality anywhere, here are two functions that are written for you.

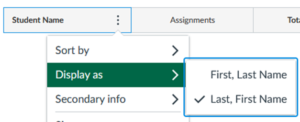
I wrote these functions because CANVAS LMS does not have separate columns for first and last names in the grade book.   However, they do have an option of showing the full name delimited by a comma.  This is preserved when you export the GradeBook.

Figure 1: Display name as separated by commas.

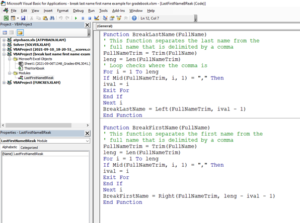
To use them, press Alt-F11.  It will open up the Microsoft Visual Basic for Applications window.  Choose Insert>Module.  It will show up as Module1 by default in the VBA Project window.  Good to rename the module to say “LastFirstNameBreak” using the Properties Window.  Cut and paste the two functions in the module, and save your excel file.  You will need to save the excel file as an .xslm file though.

Figure 2. Microsoft VBA Window.  Functions are shown below.

Function BreakLastName(FullName)
' This function separates the last name from the
' full name that is delimited by a comma
FullNameTrim = Trim(FullName)
leng = Len(FullNameTrim)
' Loop checks where the comma is
For i = 1 To leng
If Mid(FullNameTrim, i, 1) = "," Then
ival = i
Exit For
End If
Next i
BreakLastName = Left(FullNameTrim, ival - 1)
End Function
Function BreakFirstName(FullName)
' This function separates the first name from the
' full name that is delimited by a comma
FullNameTrim = Trim(FullName)
leng = Len(FullNameTrim)
For i = 1 To leng
If Mid(FullNameTrim, i, 1) = "," Then
ival = i
Exit For
End If
Next i
BreakFirstName = Right(FullNameTrim, leng - ival - 1)
End Function

To use the functions, just use them like any other Excel function.  BreakLastName separates the last name, while BreakFirstName separates the first name.

Figure 3. Using the functions in an Excel spreadsheet.

____________________________

This post is brought to you by

A javascript code for Romberg integration

As I am writing backend JavaScript for simulations in teaching Numerical Methods, I have also started developing some functions for some numerical techniques. Here is a function for Romberg integration.

function auto_integrator_trap_romb_hnm(func,a,b,nmax,tol_ae,tol_rae)
// INPUTS
// func=integrand
// a= lower limit of integration
// b= upper limit of integration
// nmax = number of partitions, n=2^nmax
// tol_ae= maximum absolute approximate error acceptable (should be >=0)
// tol_rae=maximum absolute relative approximate error acceptable (should be >=0)
// OUTPUTS
// integ_value= estimated value of integral

{
//Checking for input errors
	if (typeof a !== 'number') 
		{
		  throw new TypeError('<a> must be a number');
		}
    if (typeof b !== 'number') 
		{
		  throw new TypeError('<b> must be a number');
		}
    if ((!Number.isInteger(nmax)) || (nmax<1))
		{
		  throw new TypeError('<nmax> must be an integer greater than or equal to one.');
		}
	if ((typeof tol_ae !== 'number') || (tol_ae<0)) 
		{
		  throw new TypeError('<tole_ae> must be a number greater than or equal to zero');
		}
	if ((typeof tol_rae !== 'number') || (tol_rae<=0)) 
		{
		  throw new TypeError('<tole_ae> must be a number greater than or equal to zero');
		}
    
	var h=b-a
	// initialize matrix where the values of integral are stored
	
	var Romb = []; // rows
	for (var i = 0; i < nmax+1; i++) 
	{
		Romb.push([]);
		for (var j = 0; j < nmax+1; j++) 
		{
			Romb[i].push(math.bignumber(0)); 
		}
	}
	
	//calculating the value with 1-segment trapezoidal rule
	Romb[0][0]=0.5*h*(func(a)+func(b))
	var integ_val=Romb[0][0]
	
	for (var i=1; i<=nmax; i++)
	// updating the value with double the number of segments
	// by only using the values where they need to be calculated
	// See https://blog.autarkaw.com/2009/02/28/an-efficient-formula-for-an-automatic-integrator-based-on-trapezoidal-rule/
	{
		h=0.5*h
		var integ=0
		for (var j=1; j<=2**i-1; j+=2)
		{
			var integ=integ+func(a+j*h)
		}
	
		Romb[i][0]=0.5*Romb[i-1][0]+integ*h
		// Using Romberg method to calculate next extrapolatable value
		// See https://young.physics.ucsc.edu/115/romberg.pdf
		for (k=1; k<=i; k++)
		{   
			var addterm=Romb[i][k-1]-Romb[i-1][k-1]
			addterm=addterm/(4**k-1.0)
			Romb[i][k]=Romb[i][k-1]+addterm

			//Calculating absolute approximate error
			var Ea=math.abs(Romb[i][k]-Romb[i][k-1])
			
			//Calculating absolute relative approximate error
			var epsa=math.abs(Ea/Romb[i][k])*100.0
			
			//Assigning most recent value to the return variable
			integ_val=Romb[i][k]
			
			// returning the value if either tolerance is met
			if ((epsa<tol_rae) || (Ea<tol_ae))
			{
				return(integ_val)
			}
		}
	}
	// returning the last calculated value of integral whether tolerance is met or not
	return(integ_val)
}

Here we are testing it for a typical integrand of f(x)=1/x. Take it for a spin and see how well it works. Make it even better.

<!DOCTYPE html>
<meta content="text/html;charset=utf-8" http-equiv="Content-Type">
<meta content="utf-8" http-equiv="encoding">
<html>
<head>
	<title>A test for the automatic integrator based on Romberg integration and trapezoidal rule</title>
	https://cdnjs.cloudflare.com/ajax/libs/mathjs/5.1.2/math.min.js
	http://trap_romberg_2021.js
</head>
<body>
<script>
// This program is written to test the romberg integration scheme that is used
// as an automatic integrator
// INPUTS
// a= lower limit of integration
// b= upper limit of integraton
// nmax= number of partitions, segment is then 2^nmax 
// tol_ae= tolerance on absolute approximate error 
// tol_rae=tolerance on percentage absolute relative approximate error 
var a=0.001
var b=10
var nmax=20
var tol_ea=0.0
var tol_rae=0.0000000005

var abc=auto_integrator_trap_romb_hnm(func,a,b,nmax,tol_ea,tol_rae)
console.log("romberg "+abc)

var exact=math.log(b)-math.log(a)
console.log("exact "+exact)
function func(x)
{
   //val=math.exp(-x)
   //var pi=4*math.atan(1.0)
   //var val=2/math.sqrt(pi)*math.exp(-x*x)
   var val=1/x
   return(val)
}
</script>
</body>
</html>

____________________________

This post is brought to you by

Removing YAML from an RMD file through an R script

So you want to write a book from many RMD files using bookdown.  Here is an R script that strips the YAML lines of an Rmd file because bookdown does not accept files with its own YAML. A new file is created that has no YAML.  The program is written just for one Rmd file, and I will be writing an extension of it to do this for a whole directory including subdirectories.  I will soon write a script that will move the YAML absent RMD files and associated sub-directories to a new directory of its own.

# A program to remove YAML from an RMD file. 
# It can be modified to do this for all
# files in a directory and/or its subdirectories 
# Stay tuned for the update.

#Set the working directory
setwd("C:/Users/yoda/Rmd")

# filename of the rmd file whose YAML you want to take out
fileName <- "Chapter01.03RoundoffErrors/0103RoundOffErrorsYaml.rmd"

# Open the file to read
Input_File <- file(fileName,open="r")
linn <-readLines(Input_File)

# icapture is a vector which will check the two lines 
# that have --- in them.
icapture <- vector(,10)

# Just printing the lines in the rmd file, not needed.
#for (i in 1:length(linn)){
# print(linn[i])
#}

#The name of the file which will store YAML free RMD file.
YAML_Remove_File <- file("Chapter01.03RoundoffErrors/0103RoundOffErrorsYamlRemove.rmd",open="w")

j <- 0
#Capturing the two line numbers where --- exists
for (i in 1:length(linn)){
if(strtrim(linn[i],3) == "---"){
j <- j+1
icapture[j] <- i
}

# Write to the output file only if it has already captured two --- 
if ((j==2) & (i!=icapture[2])){
writeLines(linn[i],con2)
}
}

#close the input and output files
close(Input_File)
close(YAML_Remove_File)

____________________________

This post is brought to you by

Useful hints for a newbie on Rmarkdown

An R Markdown newbie walks on eggshells so as to not look naïve.  But the community is so nice to them, and since the help is all in the open, it reaches many more.  So here are a few items I learned beyond the usual R Markdown and the ubiquitous example about plotting something about cars.

Not Autonumbering

Don’t want to autonumber. If you write (1) First, it will automatically start numbering it. Convenient, but I do not like it sometimes. So how does one stop items from autonumbering. Just put a period sign after (1), that is, (1).  Here is an example.  This will keep the numbering the same as what is inputted.

(1).first
(2).second
(2).second
(3).numbering went away
Not wanting to center a block equation

Do you not want a block equation (an equation on its own separate line as opposed to being part of the text which is called an inline equation) to not be in the center, but wanted it tabbed instead.  It is easy to center equations by writing them within two double dollars symbols, that is, $$   $$.  But I do not like centering.  I like my block equations tabbed.

The equation
$latex a_{11} x_1+a_{12} x_2+\cdots+a_{1n}x_n=b_1$
gets centered by entering as

$$a_{11} x_1+a_{12} x_2+\cdots+a_{1n}x_n=b_1$$

The following, however, put tabs in the equation. Each &emsp puts 4 spaces.  Note also the two dollar symbols, that is, $    $, bounding the equation

&emsp;&emsp;$a_{11} x_1+a_{12} x_2+\cdots+a_{1n}x_n=b_1$
Defining often used equations

If you are using certain equation parts, again and again, you can define them.  See  here we are defining $latex \overline{X}$ and $latex \sum_{i=1}^{n}$

```{=tex}
\def\Xbar{\overline{X}}
\def\sumn{\sum_{i=1}^{n}}
```
Aligning equations to a character

Many times, you may have equations that are aligned by a character, say an equal to sign.  But if the equations get centered, the equal to sign may not get centered.  This is simply done by adding a & before the aligned character in all lines.  For example, if you want to show the following,

you would enter it as the following.  Note where the & is.

$\begin{align} 
\ S &= \int_{3}^{9}{x^2 dx}\\ 
&= \left[\frac{x^3}{3}\right]_3^9\\ 
&= \frac{9^3}{3}-\frac{9^3}{3}\\ 
&= 234 \end{align}$

____________________________

References: An Example R Markdown http://statpower.net/Content/311/R%20Stuff/SampleMarkdown.html

This post is brought to you by

Converting a Word docx file to a draft R Markdown file

Many of have been using MS Word as a word processor for decades now.  What is then an R Markdown document?  An R Markdown document is written in markdown (fancy way of saying that it is all in plain text) and embedded in it can be chunks of R code.  Once written, you can render the file into many formats including HTML, MS Word and PDF.  So, why would someone like me choose to convert a MS Word file to a R Markdown file.  Isn’t MS Word enough to meet my needs?  I have two good reasons to convert my MS word files of my open-resource Numerical Methods course to R Markdown files.

  1. On conversion from the MS Equation editor 3.0 to the currently available MS equation editor for .docx files, the equations from my old .doc documents  were getting displayed in a compact inline form.  Using the display option of an equation would have supposedly helped, but some equations refused to get properly justified, tabbing was becoming a guessing game, and using a created Word style was not helping.  Sometimes, equations would not show with letters italicized, and italicizing a single equation would change the whole document to italics font.  Ctrl+Z would help in un-italicizing the document but that was not foolproof either as it would sometimes mess up the tabs.
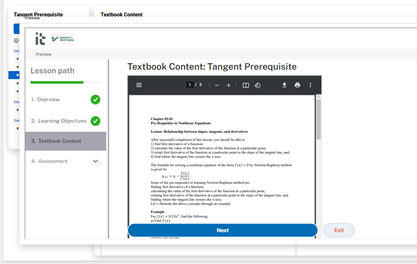
  2. The second reason was that I was embedding PDF files in a frame in an online adaptive platform lesson and even with a 12-point size in the original document, the font of the PDF files would show up too small (see Figure 1).  Yes, one can use a bigger font size in the Word file but this may not be suitable for use in, say, a printed textbook.  Maintaining different versions with different font sizes is not a recommended practice in today’s world.  A user could alternatively use the magnification option of the PDF file menu, but that creates horizontal scrolls as well in the frame.  Also, a user could download the PDF file to be opened in an acrobat reader but that is an  inconvenience imposed on them.  One could also simply embed an .htm version of the word file but such file content was getting rendered all over the place as my documents included equations, both in inline and display modes, sketches made with Word, tables imported from excel, and plots obtained from a MATLAB output, etc.


Figure 1: Embedded PDF file shows up with a small font

So the answer was simply to take Rmarkdown for a spin.  Since our documents are not simply text, it is not a cut-and-paste job with some light editing.  We turned to pandoc for this.  What pandoc is can be summarised by their slogan – “If you need to convert files from one markup format into another, pandoc is your swiss-army knife”.  Pandoc is a free software and is released under the GPL.  The full manual for pandoc is also available.

Here are the steps for how to do the conversion on a Windows 10 machine.  One has to do the conversion though at the command prompt level as I did not see an online converter that does the conversion beyond text and styles, that is, they do not convert equations, images, etc.

      1. Download pandoc (https://github.com/jgm/pandoc/releases/download/3.2/pandoc-3.2-windows-x86_64.msi) on your PC from https://pandoc.org/installing.html. Click on download installer and you will see a link for https://github.com/jgm/pandoc/releases/download/3.2/pandoc-3.2-windows-x86_64.msi
      2. Install pandoc as an administrator.
      3. Check if Pandoc is installed.  Go to the search box in your taskbar and enter “cmd” without the quotes.  Run as administrator.  You will get the cmd prompt.  At the prompt enter “pandoc --version” without the quotes.
      4. Go to the command prompt by entering “cmd” without the quotes in the search box in your taskbar.
      5. Go to the directory where the .docx file is stored.  You can do this by use cd and cd.. commands.   See here for a short guide.
      6. Once in the directory, do the following.  Let’s suppose the name of the file is “Chapter01NumericalMethods.docx”.   Type the following at the command prompt.
          • pandoc --extract-media ./"Chapter01NumericalMethodsMedia"  "Chapter01NumericalMethods.docx" -t markdown -o "Chapter01NumericalMethodsOut.md"
          • The above format extracts the media files as well and puts them in a media directory ./Chapter01NumericalMethodsMedia.  Some files may be of the .wmf format.  These can be opened in MS Paint and saved in an acceptable format such as .png.
          • I always use quotes for file names to avoid errors one gets with spaces in filenames, etc.
          • It is good practice to use a different name for the output markdown file as one may later be converting the markdown files to different formats including pdf, HTML, word, etc.  Note the output markdown file is with an .md suffix as pandoc does not have the output .rmd option.
      7. Rename the .md file as .rmd file
      8. Open the .rmd file in Rstudio to edit.

The above is a recipe for just one file.  I do gather if one has many .docx files, one could write a script to do this in a batch mode.

We will discuss some tricks to light edit the .rmd file in the next blog.  Stay tuned on the journey of this Rmarkdown newbie.  If you know a better way to do this, please let me know – autarkaw at yahoo.com.

____________________________

This post is brought to you by

Canvas quiz times for accommodating students with disabilities

Before the pandemic, university students would go to a student-accessibility-services office to take their scheduled examinations and get their needs accommodated.  These accommodations include additional time, a separate room to read aloud, and quiet environments. During the pandemic, accommodations for online examinations are generally monitored by the instructor, provided they only involve giving extra time.

I have made a mistake or two while hand calculating the assigned due time or the additional time that needs to be input in the learning management system such as CANVAS. To minimize such mistakes, I made an excel file, and it has worked well so far. In this blog, I share the excel file with you.   http://www.eng.usf.edu/~kaw/SAS/starting_end_time_for_students_with_accomodations.xlsx

Use the spreadsheet as you see fit. I have protected the cells in the excel file so that they do not get changed inadvertently – you can always unprotect (go to Review->Unprotect in the excel menu) the excel sheet and make modifications to suit your needs.

The inputs are

  1. starting time of the test or when you want the students to have access to the test
  2. time in minutes you want students to be working on the test
  3. time in minutes given to students for uploading files, if any (needed for submitting handwritten free responses, for instance) and
  4. Time over and above the length of the test to create a window in which the test is available.

The instructions for entering the above inputs are as follows.

  1. Enter the starting times in Row 10 (Columns H thru N): e.g., 2:00 PM. Mind the space between 2:00 and PM.
  2. Put the time in minutes for the test in cell H11
  3. Put the time in minutes for uploading of a file, if any. in cell H12. Enter zero if no uploading of the file is needed.
  4. Put the extra time in minutes in cell H13 for creating a window for the test.

Let’s take an example. I want to give a test that is 40-minutes long that requires students to handwrite free-responses to posed questions. They will be given additional 10 minutes to make a PDF file of the free-responses and upload the file. I want the test to start at 11:40 AM for all students but make it due at 12:45 PM, and hence give a window of 65 minutes within which to complete the test. So the extra time given in minutes to create the window is 15 minutes (65-40-10=15). Based on the example, I would enter 11:40 AM in Row 10 (Columns H thru N), 40 in cell H11, 10 in cell H12, and 15 in cell H13.

The outputs that are needed for the CANVAS LMS are shown in green color. Do not forget to go to publish the quiz, and then go to “Moderate Quiz” to add the extra time for the accommodated students.

Two of the links below are just references to show how to add extra time and add the names of students who get extra time.

Source: https://community.canvaslms.com/t5/Instructor-Guide/How-do-I-assign-a-quiz-to-an-individual-student/ta-p/714

Source: https://support.canvas.fsu.edu/kb/article/977-how-to-allow-extra-time-for-students-on-a-canvas-assessment/

____________________________

This post is brought to you by